> ## Documentation Index
> Fetch the complete documentation index at: https://snowglobe.so/docs/llms.txt
> Use this file to discover all available pages before exploring further.
# MLflow Tracing
## Overview
In this document, we explain how to set up Guardrails with MLflow Tracing. With this functionality enabled, you can collect additional insights on how your Guard, LLM, and each validator are performing directly in your own Databricks workspace.
In this notebook, we'll be using a local MLflow Tracking Server, but you can just as easily switch over to a [hosted Tracking Server](https://mlflow.org/docs/latest/getting-started/tracking-server-overview/index.html#method-3-use-production-hosted-tracking-server).
For additional background information on Mlflow Tracing, see the [MLflow documentation](https://mlflow.org/docs/latest/llms/index.html#id1).
## Installing Dependencies
Let's start by installing the dependencies we'll use in this exercise.
First we'll install Guardrails with the `databricks` extra. This will include the [mlflow](https://pypi.org/project/mlflow/) library and any other pip packages we'll need.
```python theme={null}
pip install "guardrails-ai[databricks]" -q
```
Next, we'll ensure the Guardrails CLI is properly configured. Specifically we want to use remote inferencing for one of the ML backed validators we will be using.
```python theme={null}
guardrails configure --enable-metrics --token $GUARDRAILS_TOKEN --enable-remote-inferencing
```
```python theme={null}
SUCCESS:guardrails-cli:
Login successful.
Get started by installing our RegexMatch validator:
https://hub.guardrailsai.com/validator/guardrails_ai/regex_match
You can install it by running:
guardrails hub install hub://guardrails/regex_match
Find more validators at https://hub.guardrailsai.com
```
Finally, we'll install some validators from the Guardrails Hub.
```python theme={null}
guardrails hub install hub://tryolabs/restricttotopic --no-install-local-models --quiet
guardrails hub install hub://guardrails/valid_length --quiet
```
```python theme={null}
Installing hub://tryolabs/restricttotopic...
✅Successfully installed tryolabs/restricttotopic!
Installing hub://guardrails/valid_length...
✅Successfully installed guardrails/valid_length!
```
## Starting the MLflow Tracking Server
Our next step is to start the MLflow Tracking server. This stands up both the telemetry sink we will send traces to, as well as the web interface we can use to examine them. You'll need to run this next step is a separate terminal since, otherwise, the server's processes will block execution of the conesecutive cells in this notebook (which is normal).
```python theme={null}
# Run this in the terminal or this cell will block the rest of the notebook
# ! mlflow server --host localhost --port 8080
```
## Creating and Instrumenting our Guard
Next up, we'll instrument the Guardrails package to send traces to the MLflow Tracking Server as well as setup our LLM and Guard.
As of `guardrails-ai` version 0.5.8, we offer a builtin instrumentor for MLflow.
```python theme={null}
import mlflow
from guardrails.integrations.databricks import MlFlowInstrumentor
mlflow.set_tracking_uri(uri="http://localhost:8080")
MlFlowInstrumentor(experiment_name="My First Experiment").instrument()
```
This instrumentor wraps some of the key functions and flows within Guardrails and automatically captures trace data when the Guard is run.
Now that the Guardrails package is instrumented, we can create our Guard.
```python theme={null}
from guardrails import Guard
from guardrails.hub import RestrictToTopic, ValidLength
guard = Guard(name="content-guard").use(
RestrictToTopic(
valid_topics=["computer programming", "computer science", "algorithms"],
disable_llm=True,
on_fail="exception",
),
ValidLength(min=1, max=150, on_fail="exception"),
)
```
In this example, we have created a Guard that uses two Validators: RestrictToTopic and ValidLength. The RestrictToTopic Validator ensures that the text is related to the topics we specify, while the ValidLength Guardrail ensures that the text stays within our character limit.
## Testing and Tracking our Guard
Next we'll test our our Guard by calling an LLM and letting the Guard validate the output. After each execution, we'll look at the trace data collected by MLflow Tracking Server.
```python theme={null}
import os
# Setup some environment variables for the LLM
os.environ["DATABRICKS_API_KEY"] = os.environ.get(
"DATABRICKS_TOKEN", "your-databricks-key"
)
os.environ["DATABRICKS_API_BASE"] = os.environ.get(
"DATABRICKS_HOST", "https://abc-123ab12a-1234.cloud.databricks.com"
)
```
First, we'll give the LLM an easy prompt that should result in an output that passes validation. Consider this our happy path test.
```python theme={null}
from rich import print
instructions = {
"role": "system",
"content": "You are a helpful assistant that gives advice about writing clean code and other programming practices.",
}
prompt = "Write a short summary about recursion in less than 100 characters."
try:
result = guard(
model="databricks/databricks-dbrx-instruct",
messages=[instructions, {"role": "user", "content": prompt}],
)
print(" ================== Validated LLM output ================== ")
print(result.validated_output)
except Exception as e:
print("Oops! That didn't go as planned...")
print(e)
```
````python theme={null}
================== Validated LLM output ==================
```
"Recursion: A method solving problems by solving smaller instances, calling itself with reduced input until
reaching a base case."
````
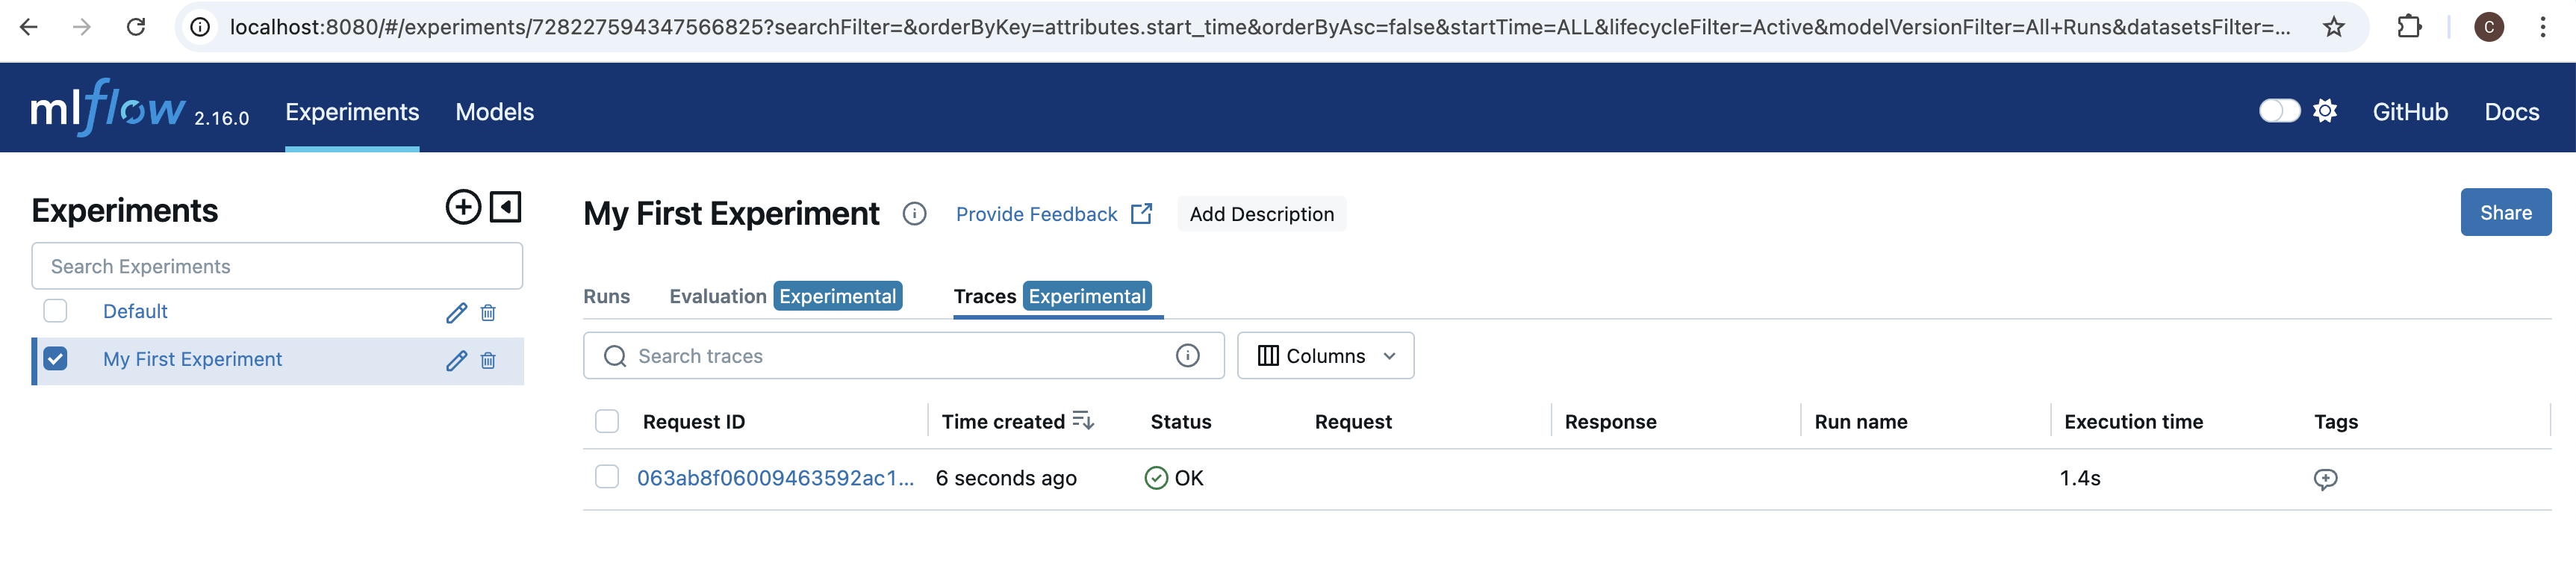
If we navigate to [http://localhost:8080](http://localhost:8080) in our browser we can see our experiemnt, `My First Experiment`, in the list on the left hand side. If we select our experiment, and then select the `Traces` tab, we should see one trace from the cell we just ran.
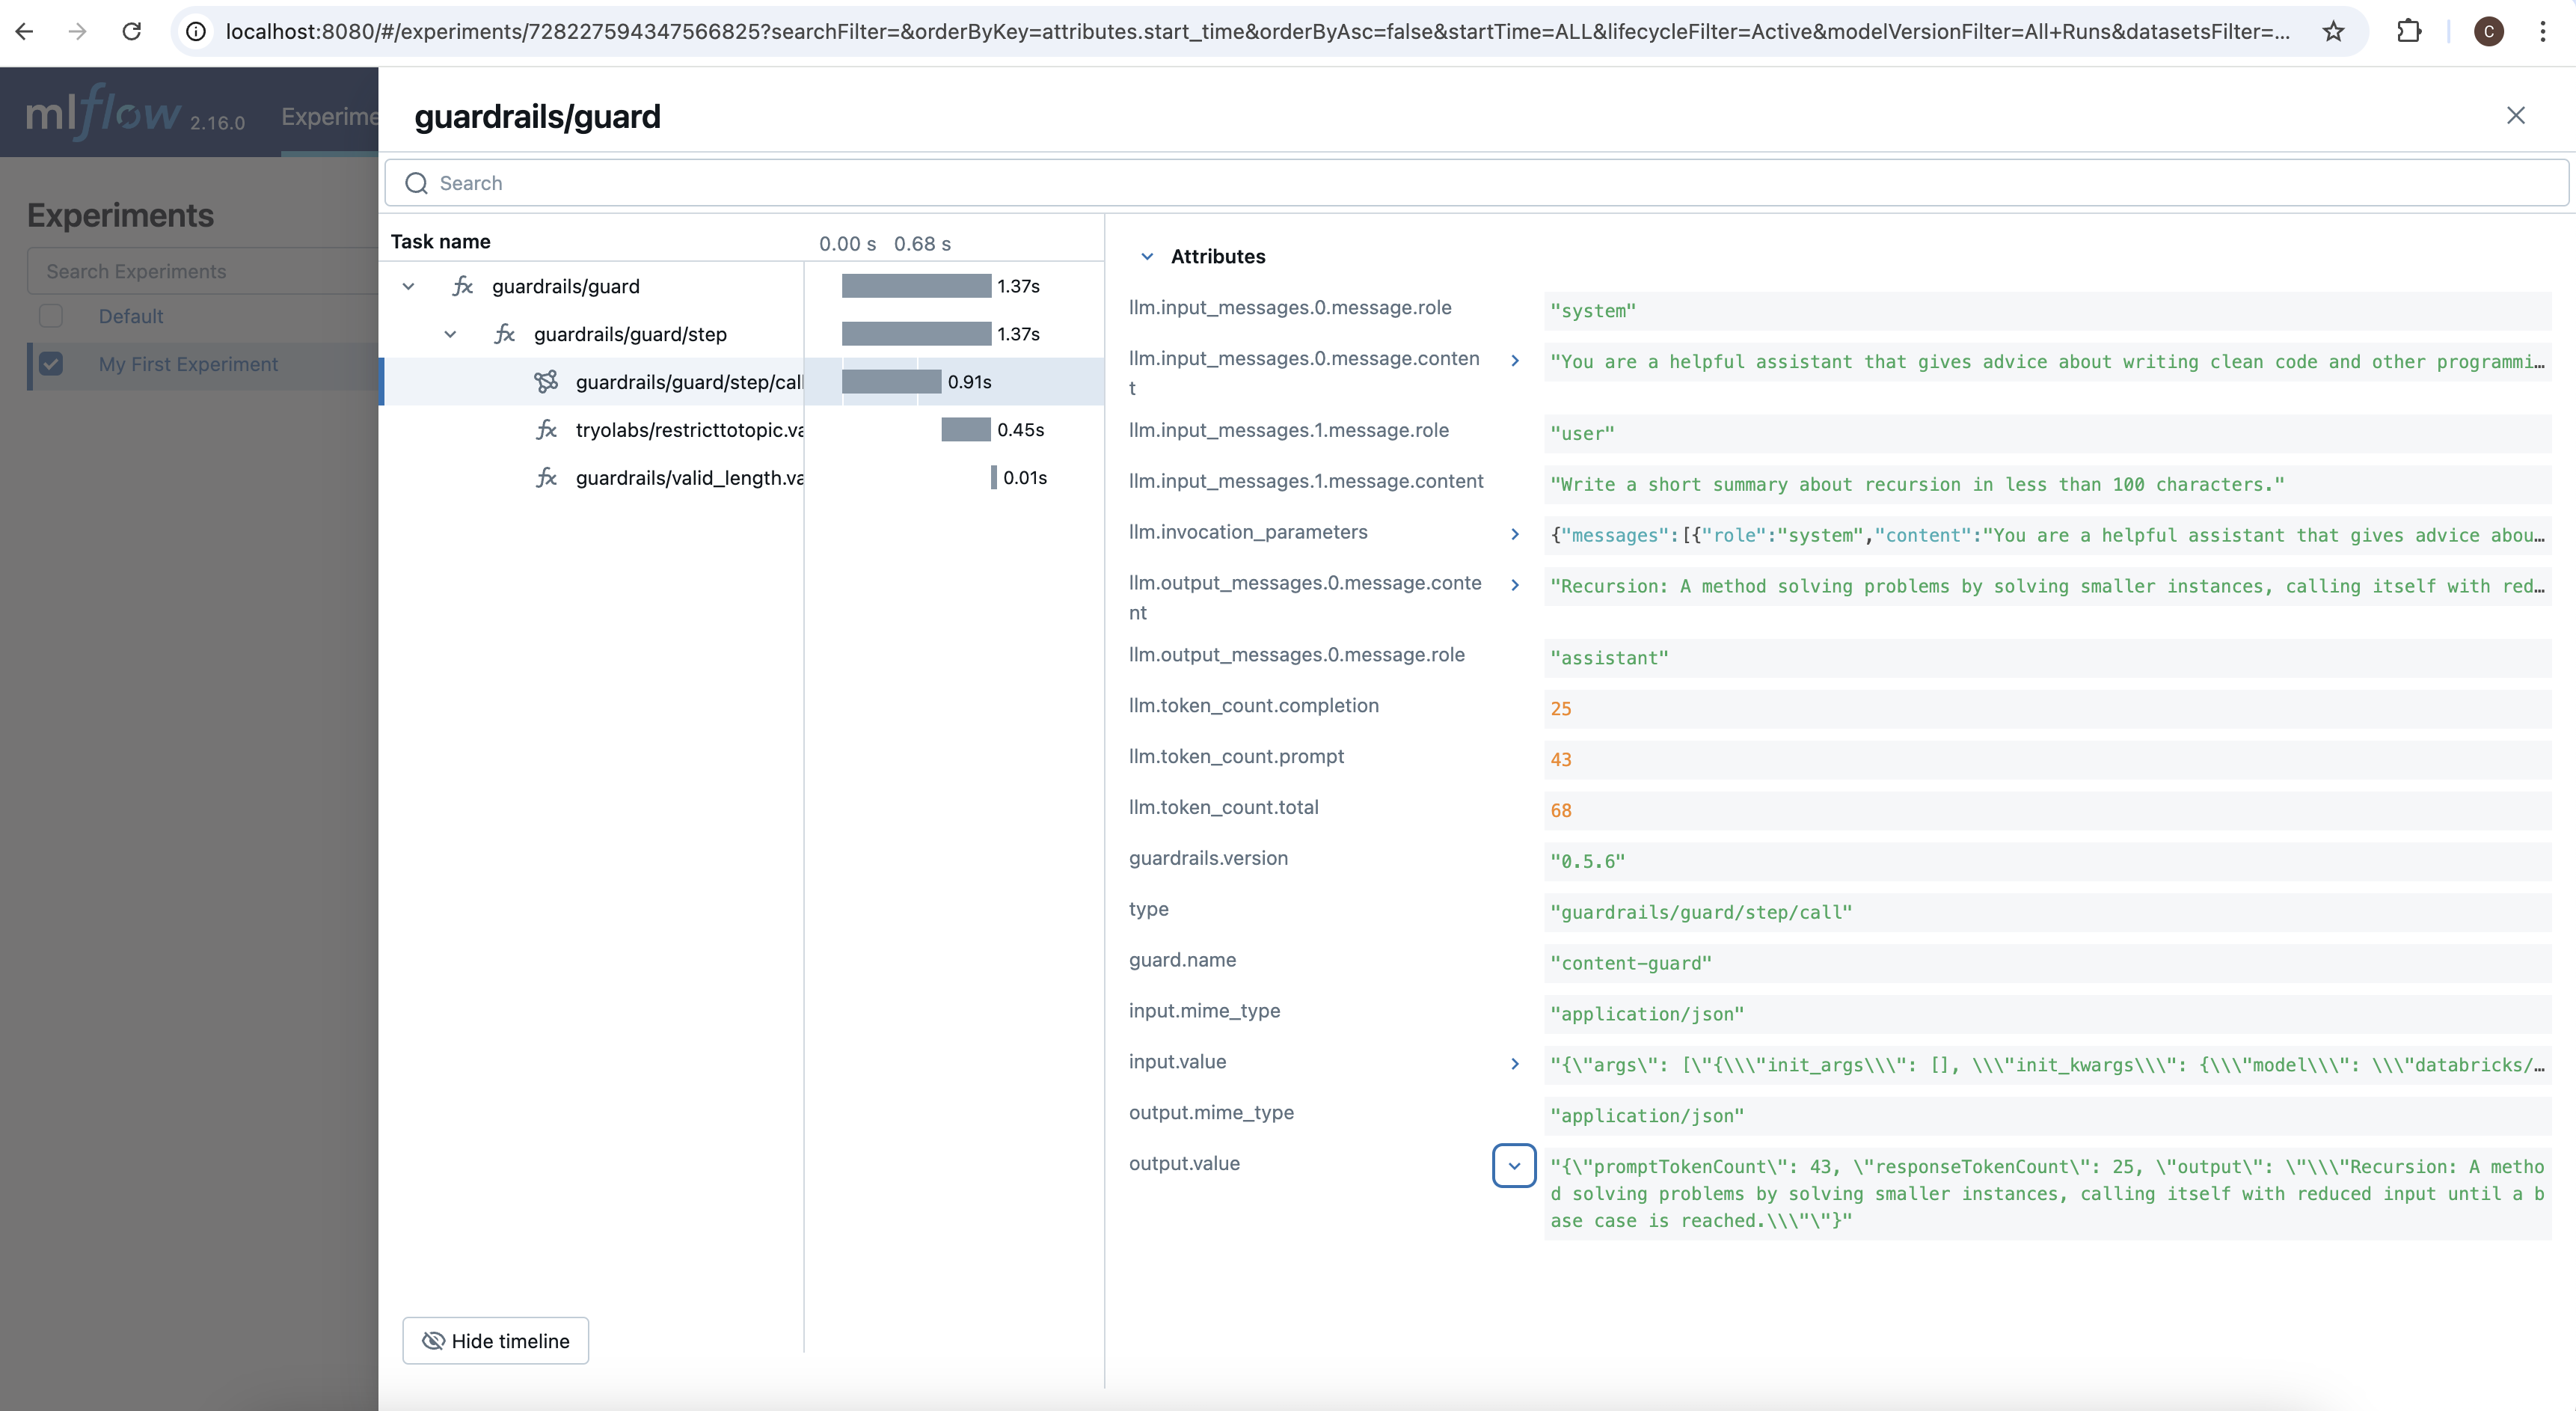
 If we select this trace, we see a breakdown of the various steps taken within the Guard on the left, including a timeline, and a details view for the selected span on the right. If you click on the different spans within the trace, you can see different attributes specific to that span. For example, if you click on `guardrails/guard/step/call`, the span that tracked the call to the LLM, you can see all of the parameters that were used to call the LLM, as well as all of the outputs from the LLM including token counts.
 Next, let's give the LLM a prompt that instructs it to output something that should fail. Consider this our exception path test.
```python theme={null}
prompt = "Write a really long poem about baseball."
try:
result = guard(
model="databricks/databricks-dbrx-instruct",
messages=[instructions, {"role": "user", "content": prompt}],
)
print("This success was unexpected. Let's look at the output to see why it passed.")
print(result.validated_output)
except Exception:
# Great! It failed just like we expected it to!
# First, let's look at what the LLM generated.
print(" ================== LLM output ================== ")
print(guard.history.last.raw_outputs.last)
# Next, let's examine the validation errors
print("\n\n ================== Validation Errors ================== ")
for failed_validation in guard.history.last.failed_validations:
print(
f"\n{failed_validation.validator_name}: {failed_validation.validation_result.error_message}"
)
```
````python theme={null}
================== LLM output ==================
```
In the realm where the green field doth lie,
Where the sun shines bright and the sky's azure high,
A game of skill, of strategy and might,
Unfolds in innings, under the sun's warm light.
Batter up, the crowd cheers with delight,
As the pitcher winds up, with all his might,
The ball whizzes fast, a blur of white,
A dance of power, in the afternoon light.
The bat meets ball, a crack, a sight,
A thrill runs through, like an electric spike,
The fielders scatter, in a frantic hike,
To catch or miss, it's all in the strike.
The bases loaded, the tension's tight,
A single run could end the night,
The crowd holds breath, in anticipation's height,
For the game's outcome, in this baseball fight.
The outfielder leaps, with all his height,
A catch or miss, could decide the plight,
The ball falls short, in the glove's tight knit,
A collective sigh, as the inning's writ.
The game goes on, through day and night,
A battle of wills, in the stadium's light,
A symphony of plays, in the diamond's sight,
A poem of baseball, in black and white.
```
================== Validation Errors ==================
```
RestrictToTopic: No valid topic was found.
````
First note that there is only one failed validator in the logs: `RestrictToTopic`. This is because since we set `on_fail="exception"`, the first failure to occur will raise an exception and interrupt the process. If we set our OnFail action to a different value, like `noop`, we would also see a log for `ValidLength` since the LLM's output is clearly longer than the max length we specified.
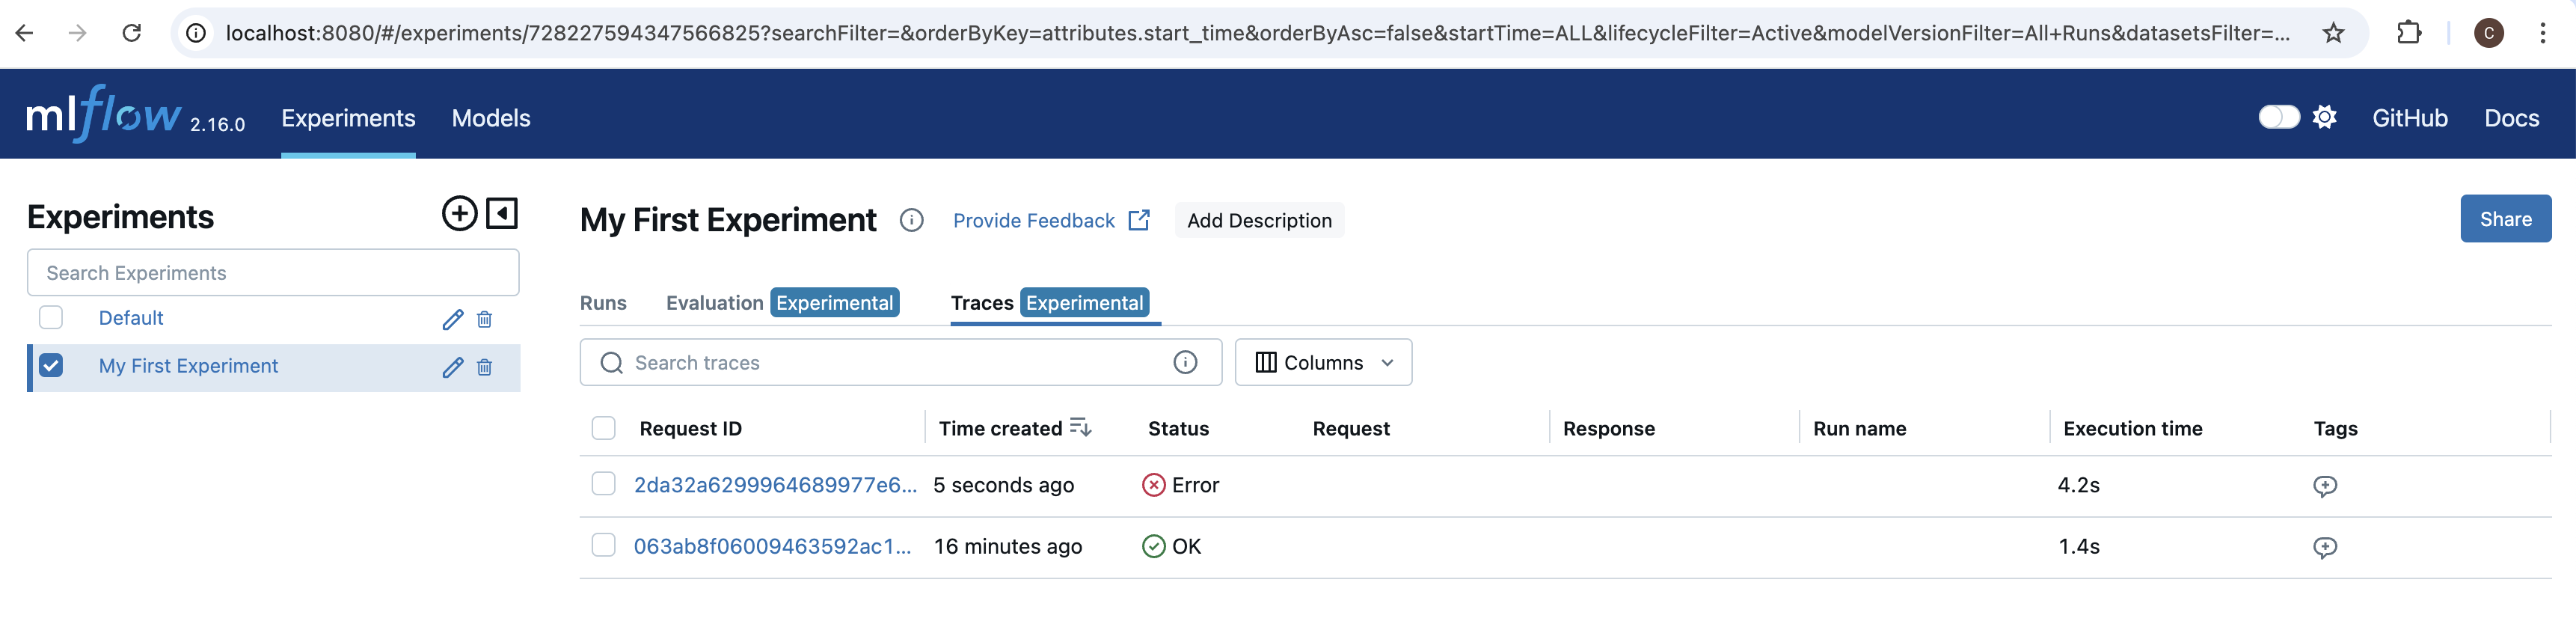
If navigate back to the MLflow UI in our browser, we see another trace. Since this last cell raised an exception, we see that the status is listed as `Error`.
Next, let's give the LLM a prompt that instructs it to output something that should fail. Consider this our exception path test.
```python theme={null}
prompt = "Write a really long poem about baseball."
try:
result = guard(
model="databricks/databricks-dbrx-instruct",
messages=[instructions, {"role": "user", "content": prompt}],
)
print("This success was unexpected. Let's look at the output to see why it passed.")
print(result.validated_output)
except Exception:
# Great! It failed just like we expected it to!
# First, let's look at what the LLM generated.
print(" ================== LLM output ================== ")
print(guard.history.last.raw_outputs.last)
# Next, let's examine the validation errors
print("\n\n ================== Validation Errors ================== ")
for failed_validation in guard.history.last.failed_validations:
print(
f"\n{failed_validation.validator_name}: {failed_validation.validation_result.error_message}"
)
```
````python theme={null}
================== LLM output ==================
```
In the realm where the green field doth lie,
Where the sun shines bright and the sky's azure high,
A game of skill, of strategy and might,
Unfolds in innings, under the sun's warm light.
Batter up, the crowd cheers with delight,
As the pitcher winds up, with all his might,
The ball whizzes fast, a blur of white,
A dance of power, in the afternoon light.
The bat meets ball, a crack, a sight,
A thrill runs through, like an electric spike,
The fielders scatter, in a frantic hike,
To catch or miss, it's all in the strike.
The bases loaded, the tension's tight,
A single run could end the night,
The crowd holds breath, in anticipation's height,
For the game's outcome, in this baseball fight.
The outfielder leaps, with all his height,
A catch or miss, could decide the plight,
The ball falls short, in the glove's tight knit,
A collective sigh, as the inning's writ.
The game goes on, through day and night,
A battle of wills, in the stadium's light,
A symphony of plays, in the diamond's sight,
A poem of baseball, in black and white.
```
================== Validation Errors ==================
```
RestrictToTopic: No valid topic was found.
````
First note that there is only one failed validator in the logs: `RestrictToTopic`. This is because since we set `on_fail="exception"`, the first failure to occur will raise an exception and interrupt the process. If we set our OnFail action to a different value, like `noop`, we would also see a log for `ValidLength` since the LLM's output is clearly longer than the max length we specified.
If navigate back to the MLflow UI in our browser, we see another trace. Since this last cell raised an exception, we see that the status is listed as `Error`.
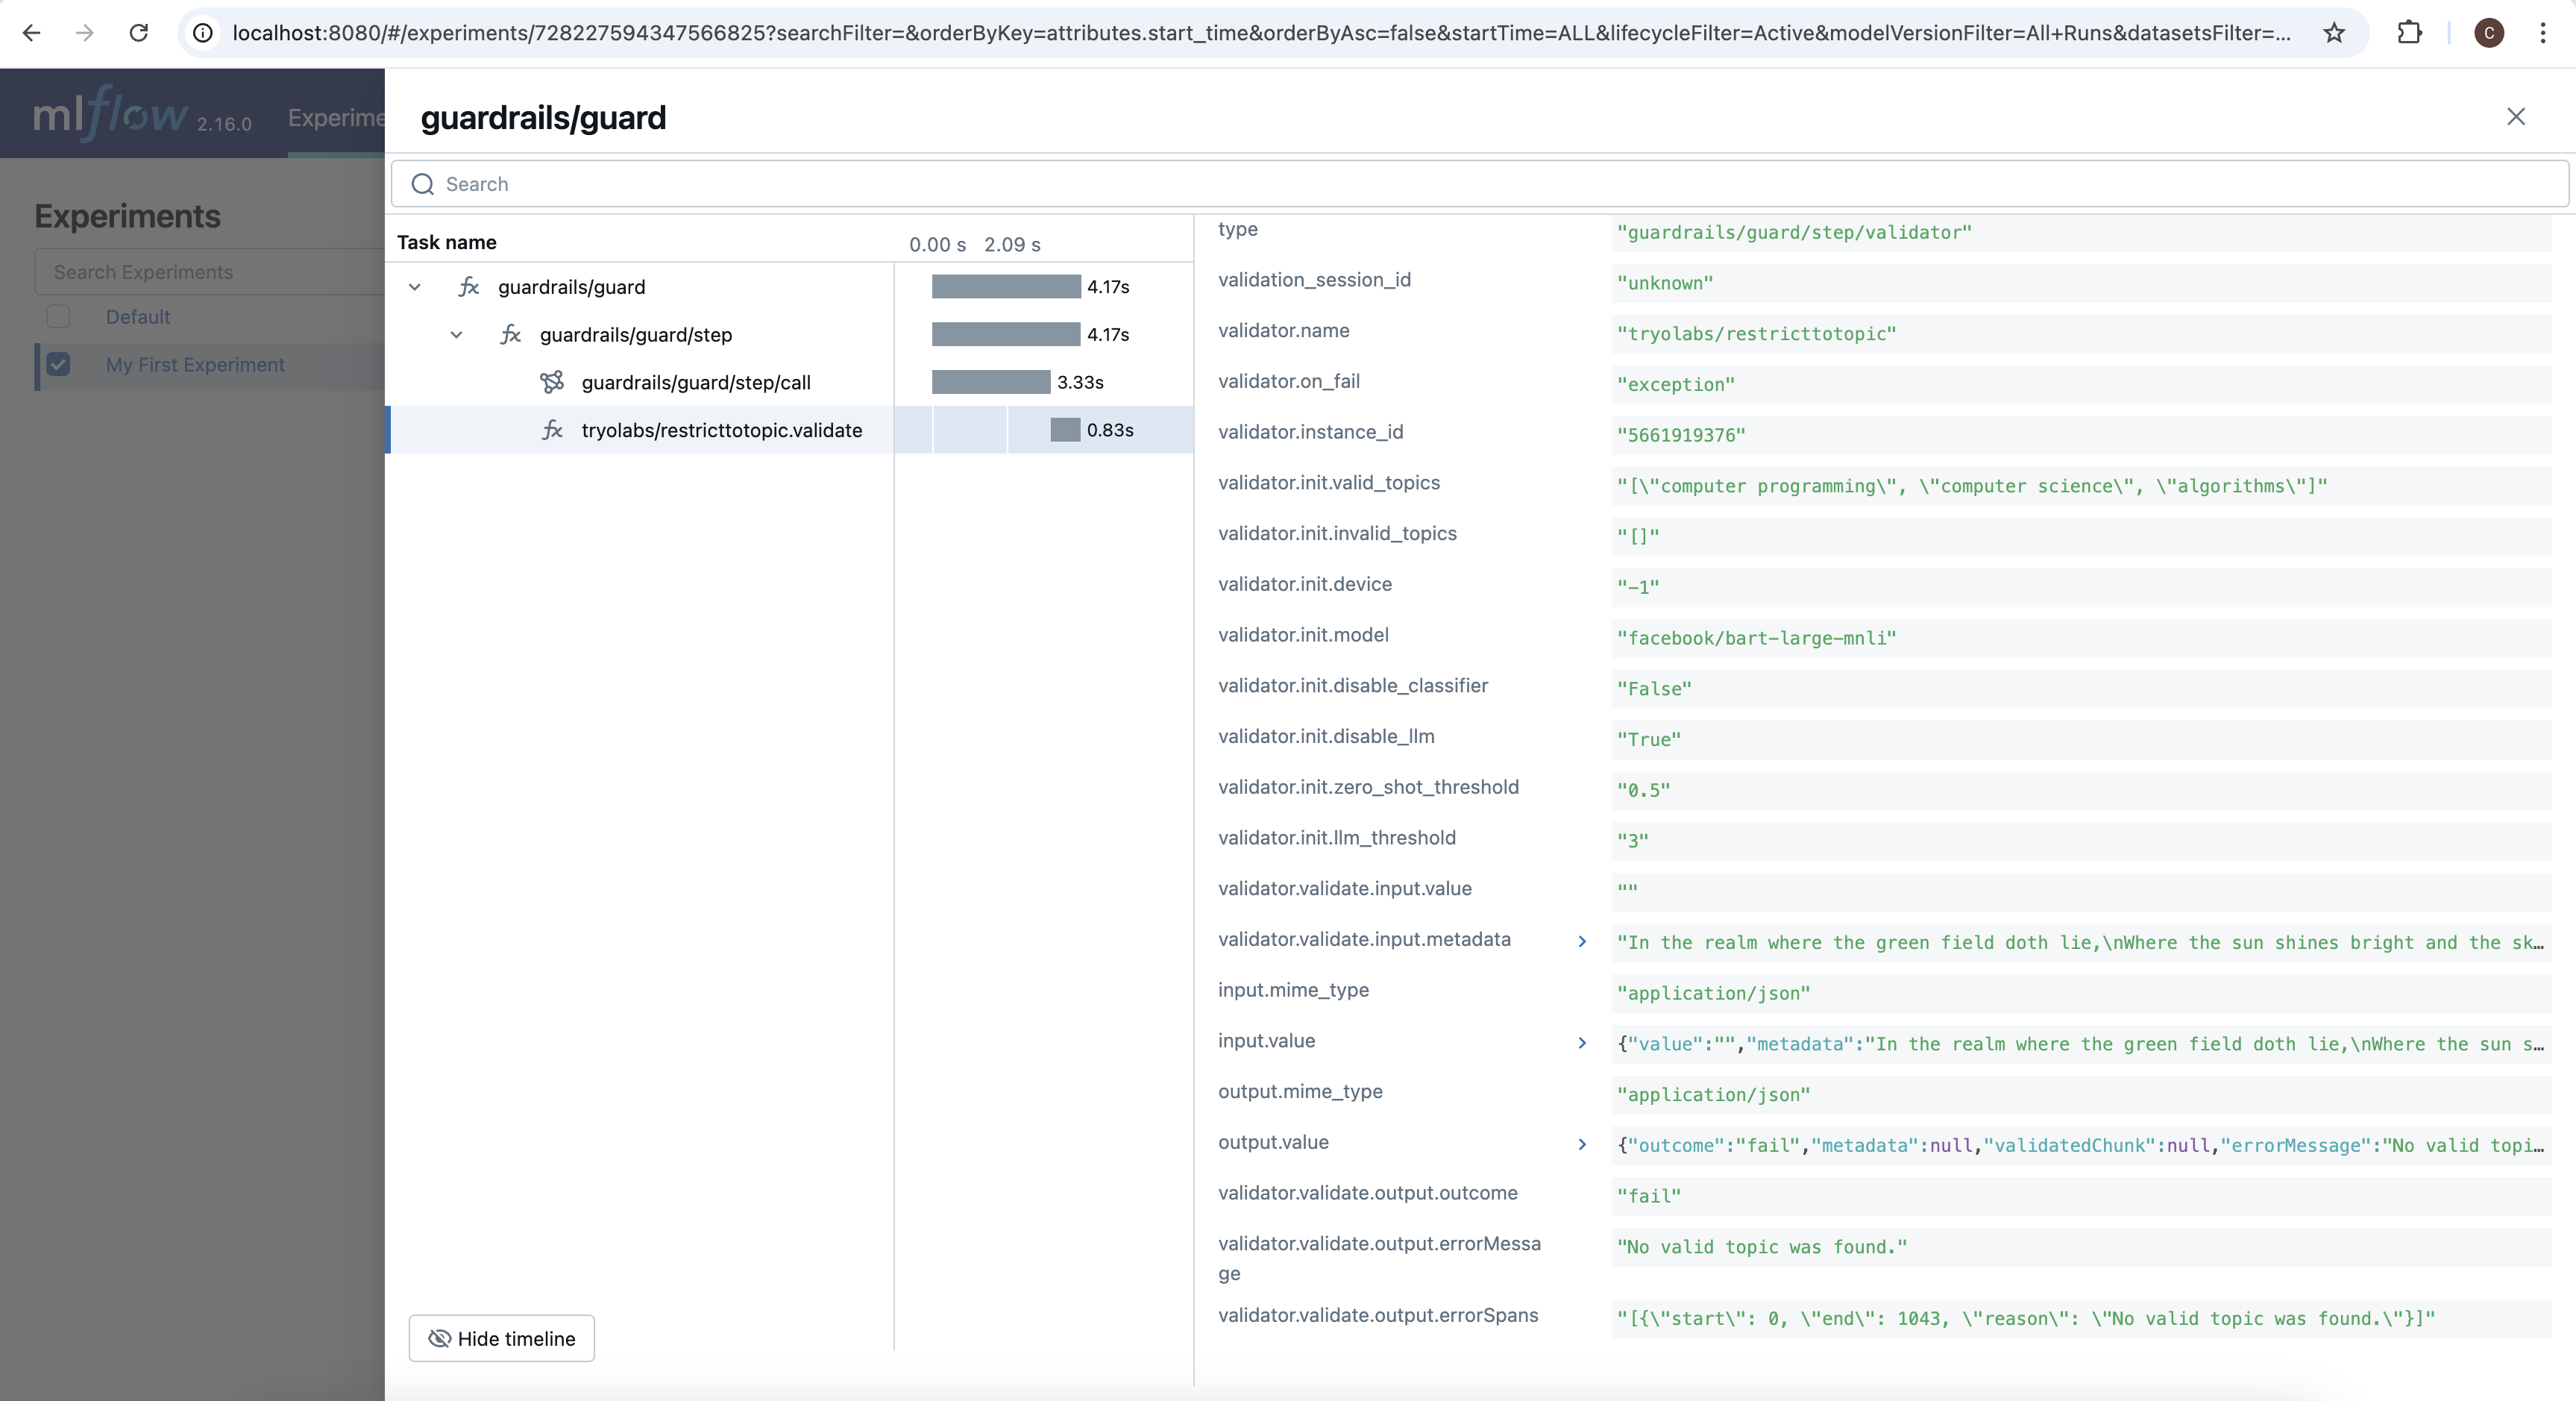
 If we open this new trace we see, just like in the history logs, only `RestrictToTopic` has a recorded span. This is, again, because it raised an exception on failure exitting the validation loop early.
If we click on the validator's span, and scroll down to the bottom of its details panel, we can see the reason why validation failed: `"No valid topic was found."`
If we open this new trace we see, just like in the history logs, only `RestrictToTopic` has a recorded span. This is, again, because it raised an exception on failure exitting the validation loop early.
If we click on the validator's span, and scroll down to the bottom of its details panel, we can see the reason why validation failed: `"No valid topic was found."`
 ## Conclusion
With Guardrails, MLflow, and the Guardrails MLflowInstrumentor, we can easily monitor both our LLMs and the validations we're guarding them with. To learn more, check out [Guardrails AI](https://www.guardrailsai.com/) and [MLflow](https://mlflow.org/docs/latest/index.html).
## Conclusion
With Guardrails, MLflow, and the Guardrails MLflowInstrumentor, we can easily monitor both our LLMs and the validations we're guarding them with. To learn more, check out [Guardrails AI](https://www.guardrailsai.com/) and [MLflow](https://mlflow.org/docs/latest/index.html).