Jun 27, 2024
Guardrails 🤝 OTEL: Monitor LLM Application Performance with Existing Observability Tools

More applications are leveraging large Language Models (LLMs) to add AI functionality to their applications quickly. Using a purpose-built LLM in conjunction with techniques like Retrieval-Augmented Generation (RAG) can enable you to add intelligent automation to your business quickly and with minimal development overhead.
However, not all LLMs are built equally. If you're not collecting data on how your LLMs are performing, you could end up struggling with multiple issues, including:
Exorbitant token fees that can quickly drain budgets
High latency in LLM API calls, impacting user experience
Difficulty in establishing confidence in LLM performance
Incorrect or hallucinated responses that undermine confidence and jeopardize trust with your customers.
Guardrails enables developers to gain confidence in LLM results by enabling the creation of guards that can verify responses. Now, Guardrails also supports increasing LLM application quality with observability support via OpenTelemetry.
In this article, I'll discuss the importance of observability for LLM applications, how Guardrails enables LLM telemetry, the use cases it opens up, and how you can implement it easily using Guardrails.
The importance of observability with LLMs
Observability enables you to monitor, measure, and assess the state of a software system at any moment in time. It's the equivalent of an instrument control panel in a plane. Without observability, you're flying blind. With observability, you can:
Assess how well your system is performing - how much memory CPU, storage, network bandwidth etc. it's consuming at a given time
Detect any anomalous changes - e.g, a sudden slowdown in a procedure, a memory or usage spike, etc.
Generate alerts and analyze the root cause of an issue to heal your system quickly and prevent expensive downtime
Observability support is important when adding an LLM to your application because you're taking a hard dependency on a remote system. That opens up several potential pitfalls in ensuring good reliability and performance:
Availability. If an LLM's API is down or unreachable due to network issues, your only options are to call another LLM or wait until the remote service is reachable again. This can lead to a negative user experience if your LLM-driven app is slow or unavailable.
Network latency. A slow network or network congestion can increase how long users have to wait for a response. These delays can be fatal for AI use cases such as support, where customers expect responses quickly.
LLM processing time. As we've covered before in our LLM benchmarking discussion, different LLMs can perform better or worse at specific tasks.
Why Guardrails adopted OpenTelemetry
Guardrails is a validation library designed specifically for LLMs. Using Guardrails, you can instantiate a Guard, which consists of one or more validators. You can use Guards to reduce LLM hallucinations, validate synthetic structured data, and ensure accurate information retrieval from unstructured documents, among many other scenarios.
With Guardrails, you can now measure and monitor common evaluation metrics (usage patterns, LLM execution times) and guardrails metrics (failed validations, thresholds, session validations). We chose OpenTelemetry because open AI reliability is core to our mission with our industry-leading open-source guardrails package
To enable observability in AI apps, we've provided support for OpenTelemetry for metrics due to its status as an open-source industry standard. OpenTelemetry enables collecting logs, metrics, and traces.
What you can track with Guardrails OpenTelemetry support
Using OpenTelemetry with Guardrails enables tracking a number of performance characteristics of LLMs. You can then send them to a backend storage and processing solution, where you can perform data analysis and visualization using your data analytical platform of choice. That enables you to track a number of use cases, including:
Guard and validator latency. See how long it takes a specific Guard and its individual validators to process and determine whether the results returned from an LLM match the Guard's validator's criteria. You can use this to measure performance against return results from built-in validators as well as to benchmark performance for your custom validators.
LLM latency. Judge how long it takes different LLMs to produce results to find the one that yields optimal performance for your problem domain.
Guard success rate. Use Guards success rate to fine-tune your prompts for greater accuracy. You can also use success rate to benchmark LLM accuracy rates against one another to find the one best suited to your use case.
Validator pass/fail. See which specific validators pass or fail - not just in a single Guard, but across all Guards as well. This enables you to identify which validators are most often causing your Guards to fail.
Getting started with OpenTelemetry for Guardrails
With each run, Guardrails AI sends information on run duration and status for each LLM run you make. This enables you to trace duration across runs and monitor guard performance easily over the lifetime of your app.
To get started with OpenTelemetry with Guardrails, you need only set up an OpenTelemetry collector as discussed in the OpenTelemetry collector configuration docs. Once that's done, you can change your Guardrails code to send data to the collector by adding a single function argument.
For example, a normal Guardrails call in Python that checks to ensure a return value is of a specified length would look like this:
To capture metrics, just add a tracer parameter to the Guard call:
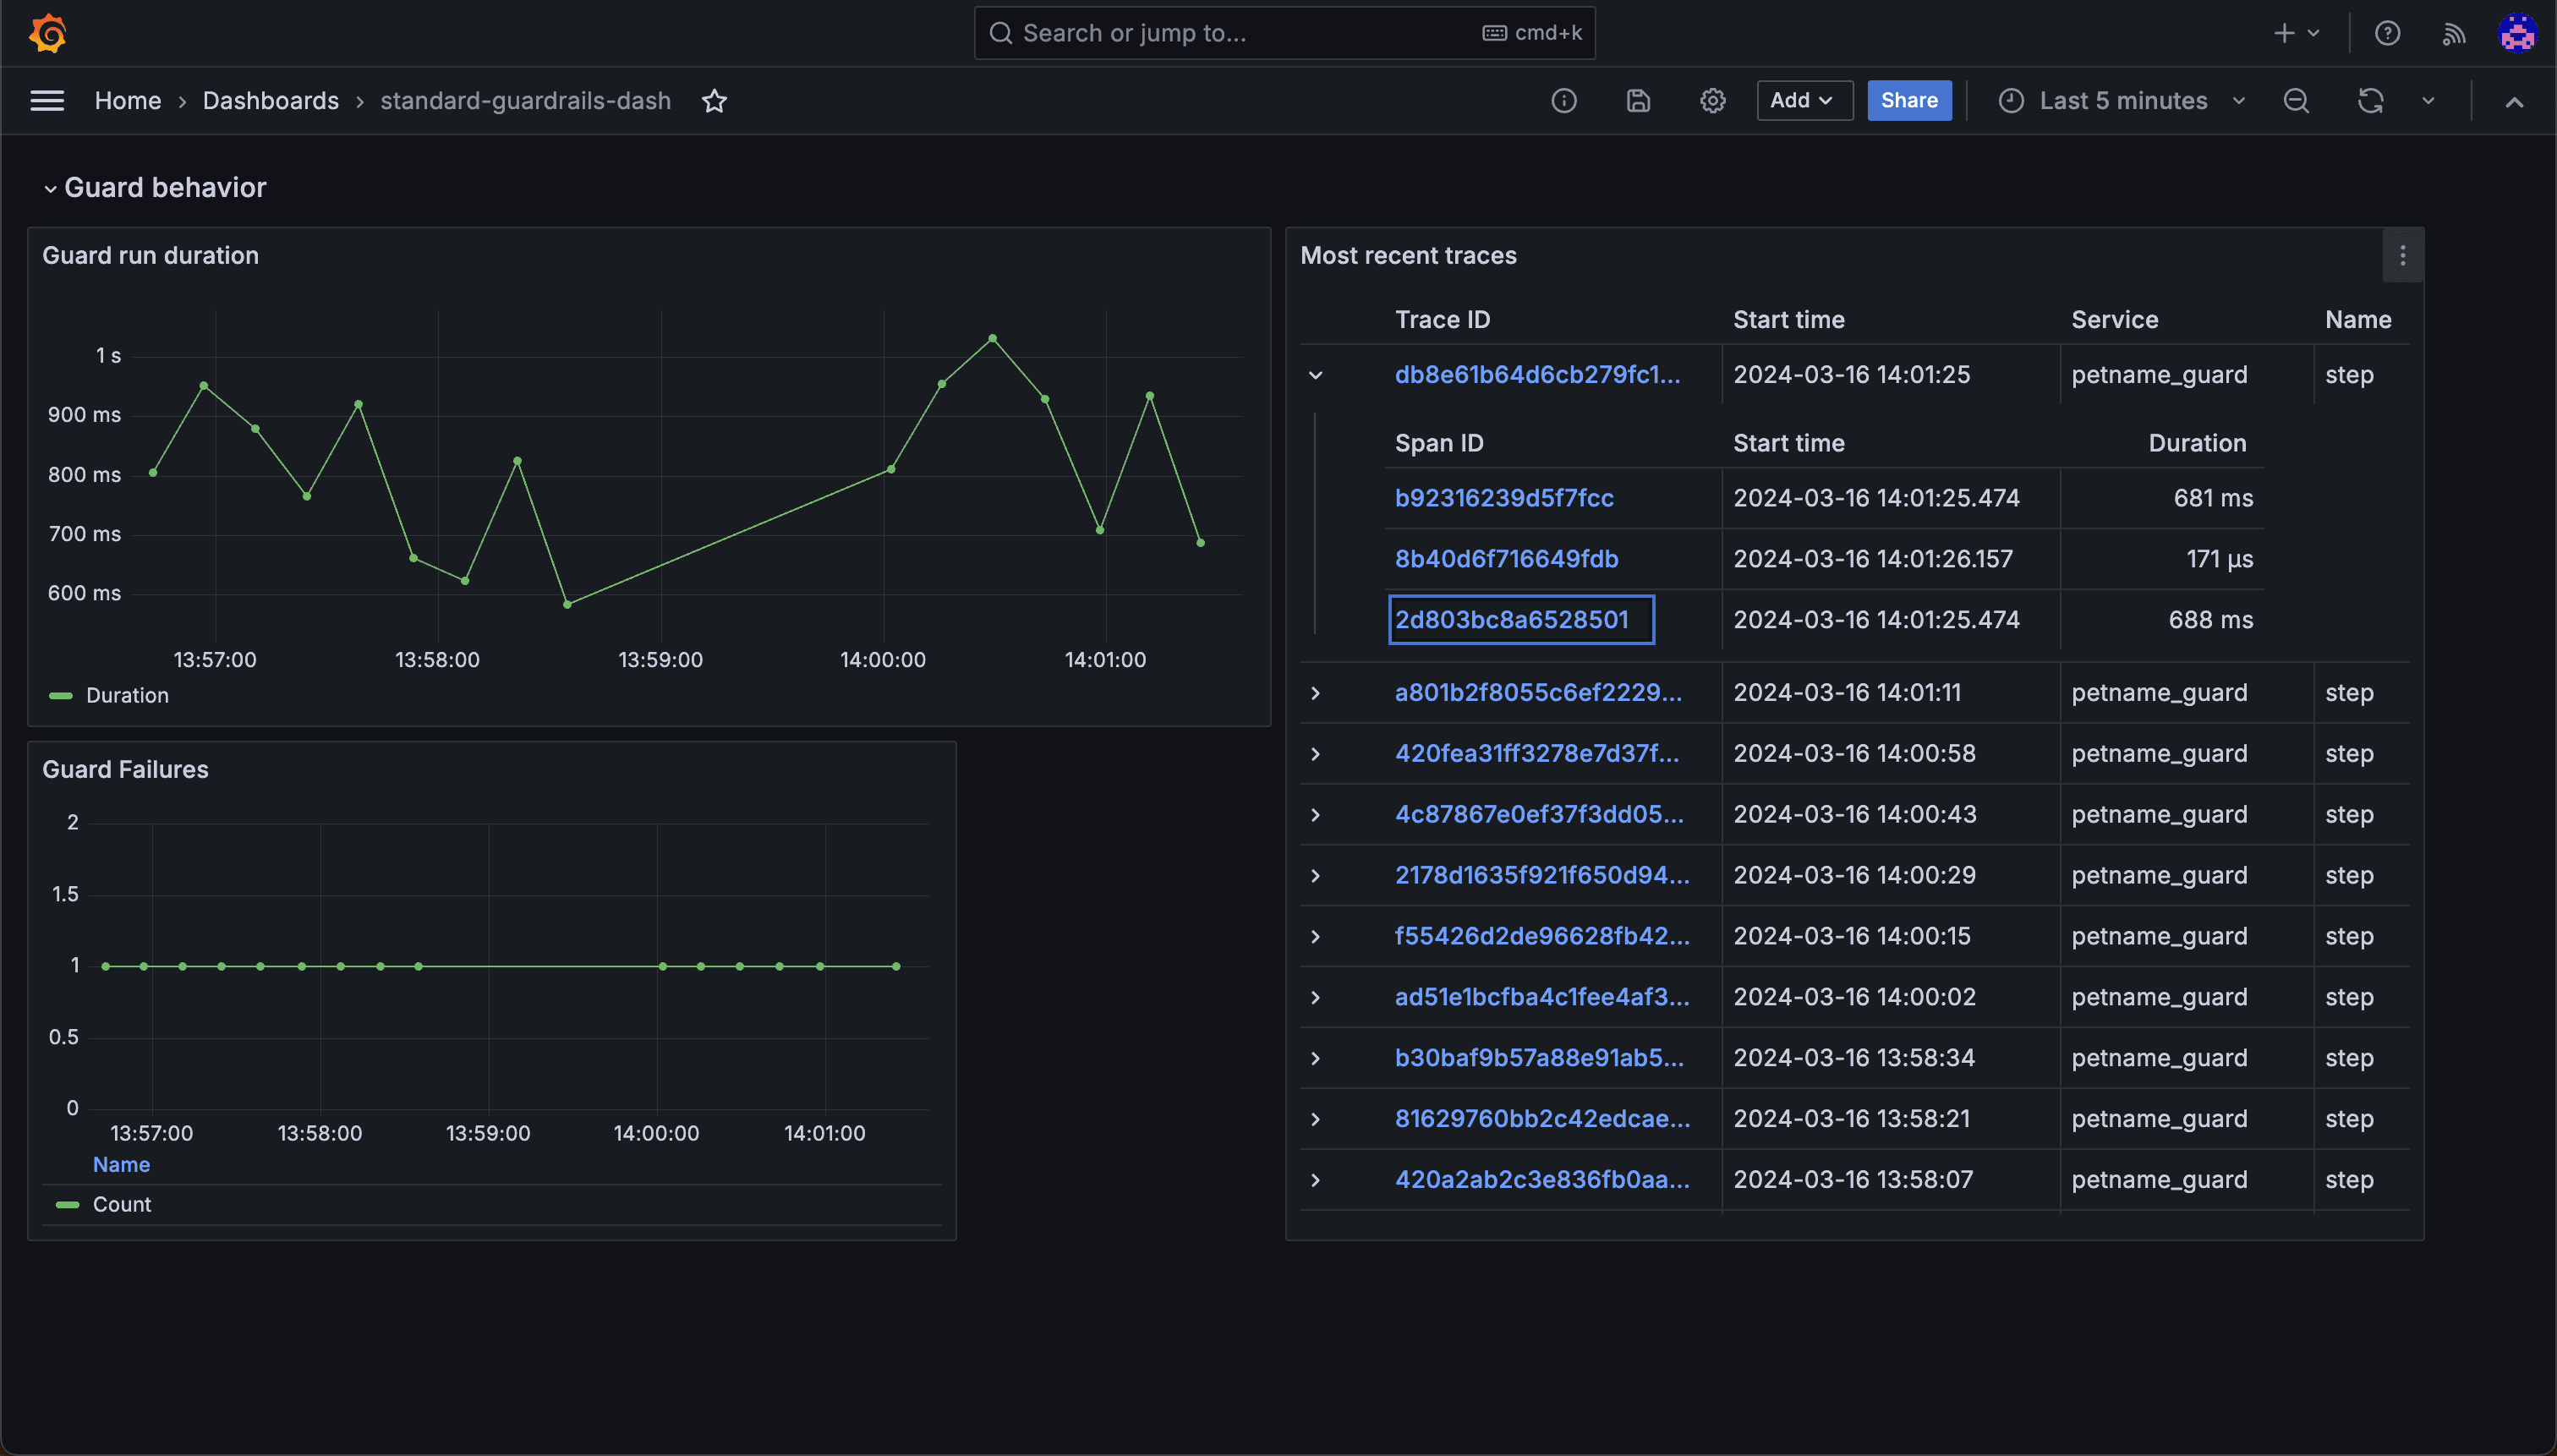
You can configure Guardrails to work with any tool that supports OpenTelemetry. For example, you can use Guardrails with Grafana to capture, store, and render graphs that provide insights into your LLM usage. We also provide a default Guardrails dashboard that you can import into your own Grafana account.
Once you start collecting data, you can create dashboards that show statistics such as guard run durations, validation pass/fail rates, Guard success rates, latency, and metrics for individual traces. This enables you both to get an overview of LLM and Guard performance in your application, as well as identify and diagnose issues in specific LLM calls.
Conclusion
It's not enough to tell how well a third-party LLM is performing in relation to common metrics such as latency. You also need to know how accurate the LLM's responses are. With Guardrails and OpenTelemetry support, you can now measure both at a glance across all of your AI-driven applications.