Jul 29, 2024
The new Uptime for LLM apps

If an LLM falls in a (random) forest…
Is it working?
Everyone who's worked on production software has war stories about when they had to fix a bug or outage that made its way into prod. Some of the most harrowing stories are about gray failures - when requests sometimes succeed and sometimes fail. The first part of all of these stories is how the issue is detected. Every SRE's nightmares includes finding out a severe bug made it into production because a user encountered it. If a user tells you about it, it's usually the case that tens or hundreds of other users encountered the same issue without telling you. Owners of these apps and systems have long understood the value of automatically tracking failures. Tracking failures in production software is key to maintaining smooth operations and continuously improving systems.
I wonder how SREs react to LLM failures. It can't be good that nearly every failure is a gray failure.
Detecting failures in LLM apps is not straightforward. LLM apps don't fail like traditional software. While traditional software throws exceptions, rejects API requests, and blows up your PagerDuty, LLM APIs at most respond with 200s whose content tell users their requests have been denied. There are more straightforward failure cases for some LLM uses, like when an output of a specific structure (specific json keys, response length) is malformed or breaks criteria. But then there are more illusory failure cases - when an LLM veers off topic, for example. Breaking on these failures (which we call ‘guardrailing') is difficult, and tracking those failures at scale is also a problem.
In this blogpost, we'll discuss how to track failures in LLM apps, and which metrics are the most important to watch.
What does Guardrails AI do?
Guardrails makes it straightforward to detect failures in LLM inputs and responses. Let's build a chatbot called “Thanksgiving dinner”. It's a themed bot that acts like an uncle at a Thanksgiving dinner and asks you about your day and your life and wants to catch up with you. But, as good stewards of this bot, we want to make sure the uncle doesn't talk about politics during dinner, because that can be… a lot. So we can install the RestrictToTopic validator from the Guardrails hub - the central repository of all such validators - and add it to the bot. Now, the bot will explicitly and programatically throw an error if it detects talk of politics.
We'll ask it something specifically, what it thinks of the Supreme Court:
And this throws
This is great because now we can easily detect and manipulate data from failed LLM responses. We can do something as simple as wrap this in a try/except block and write out specific log lines that we can grok or scan later. We can alert on the specific exception name that we raise or a constant in the log line.
This allows us to detect actual LLM failures in production. But we can do more, go further, and make it easier to identify how our app is failing by using more advanced telemetry and dashboards.
Guardrails as metrics
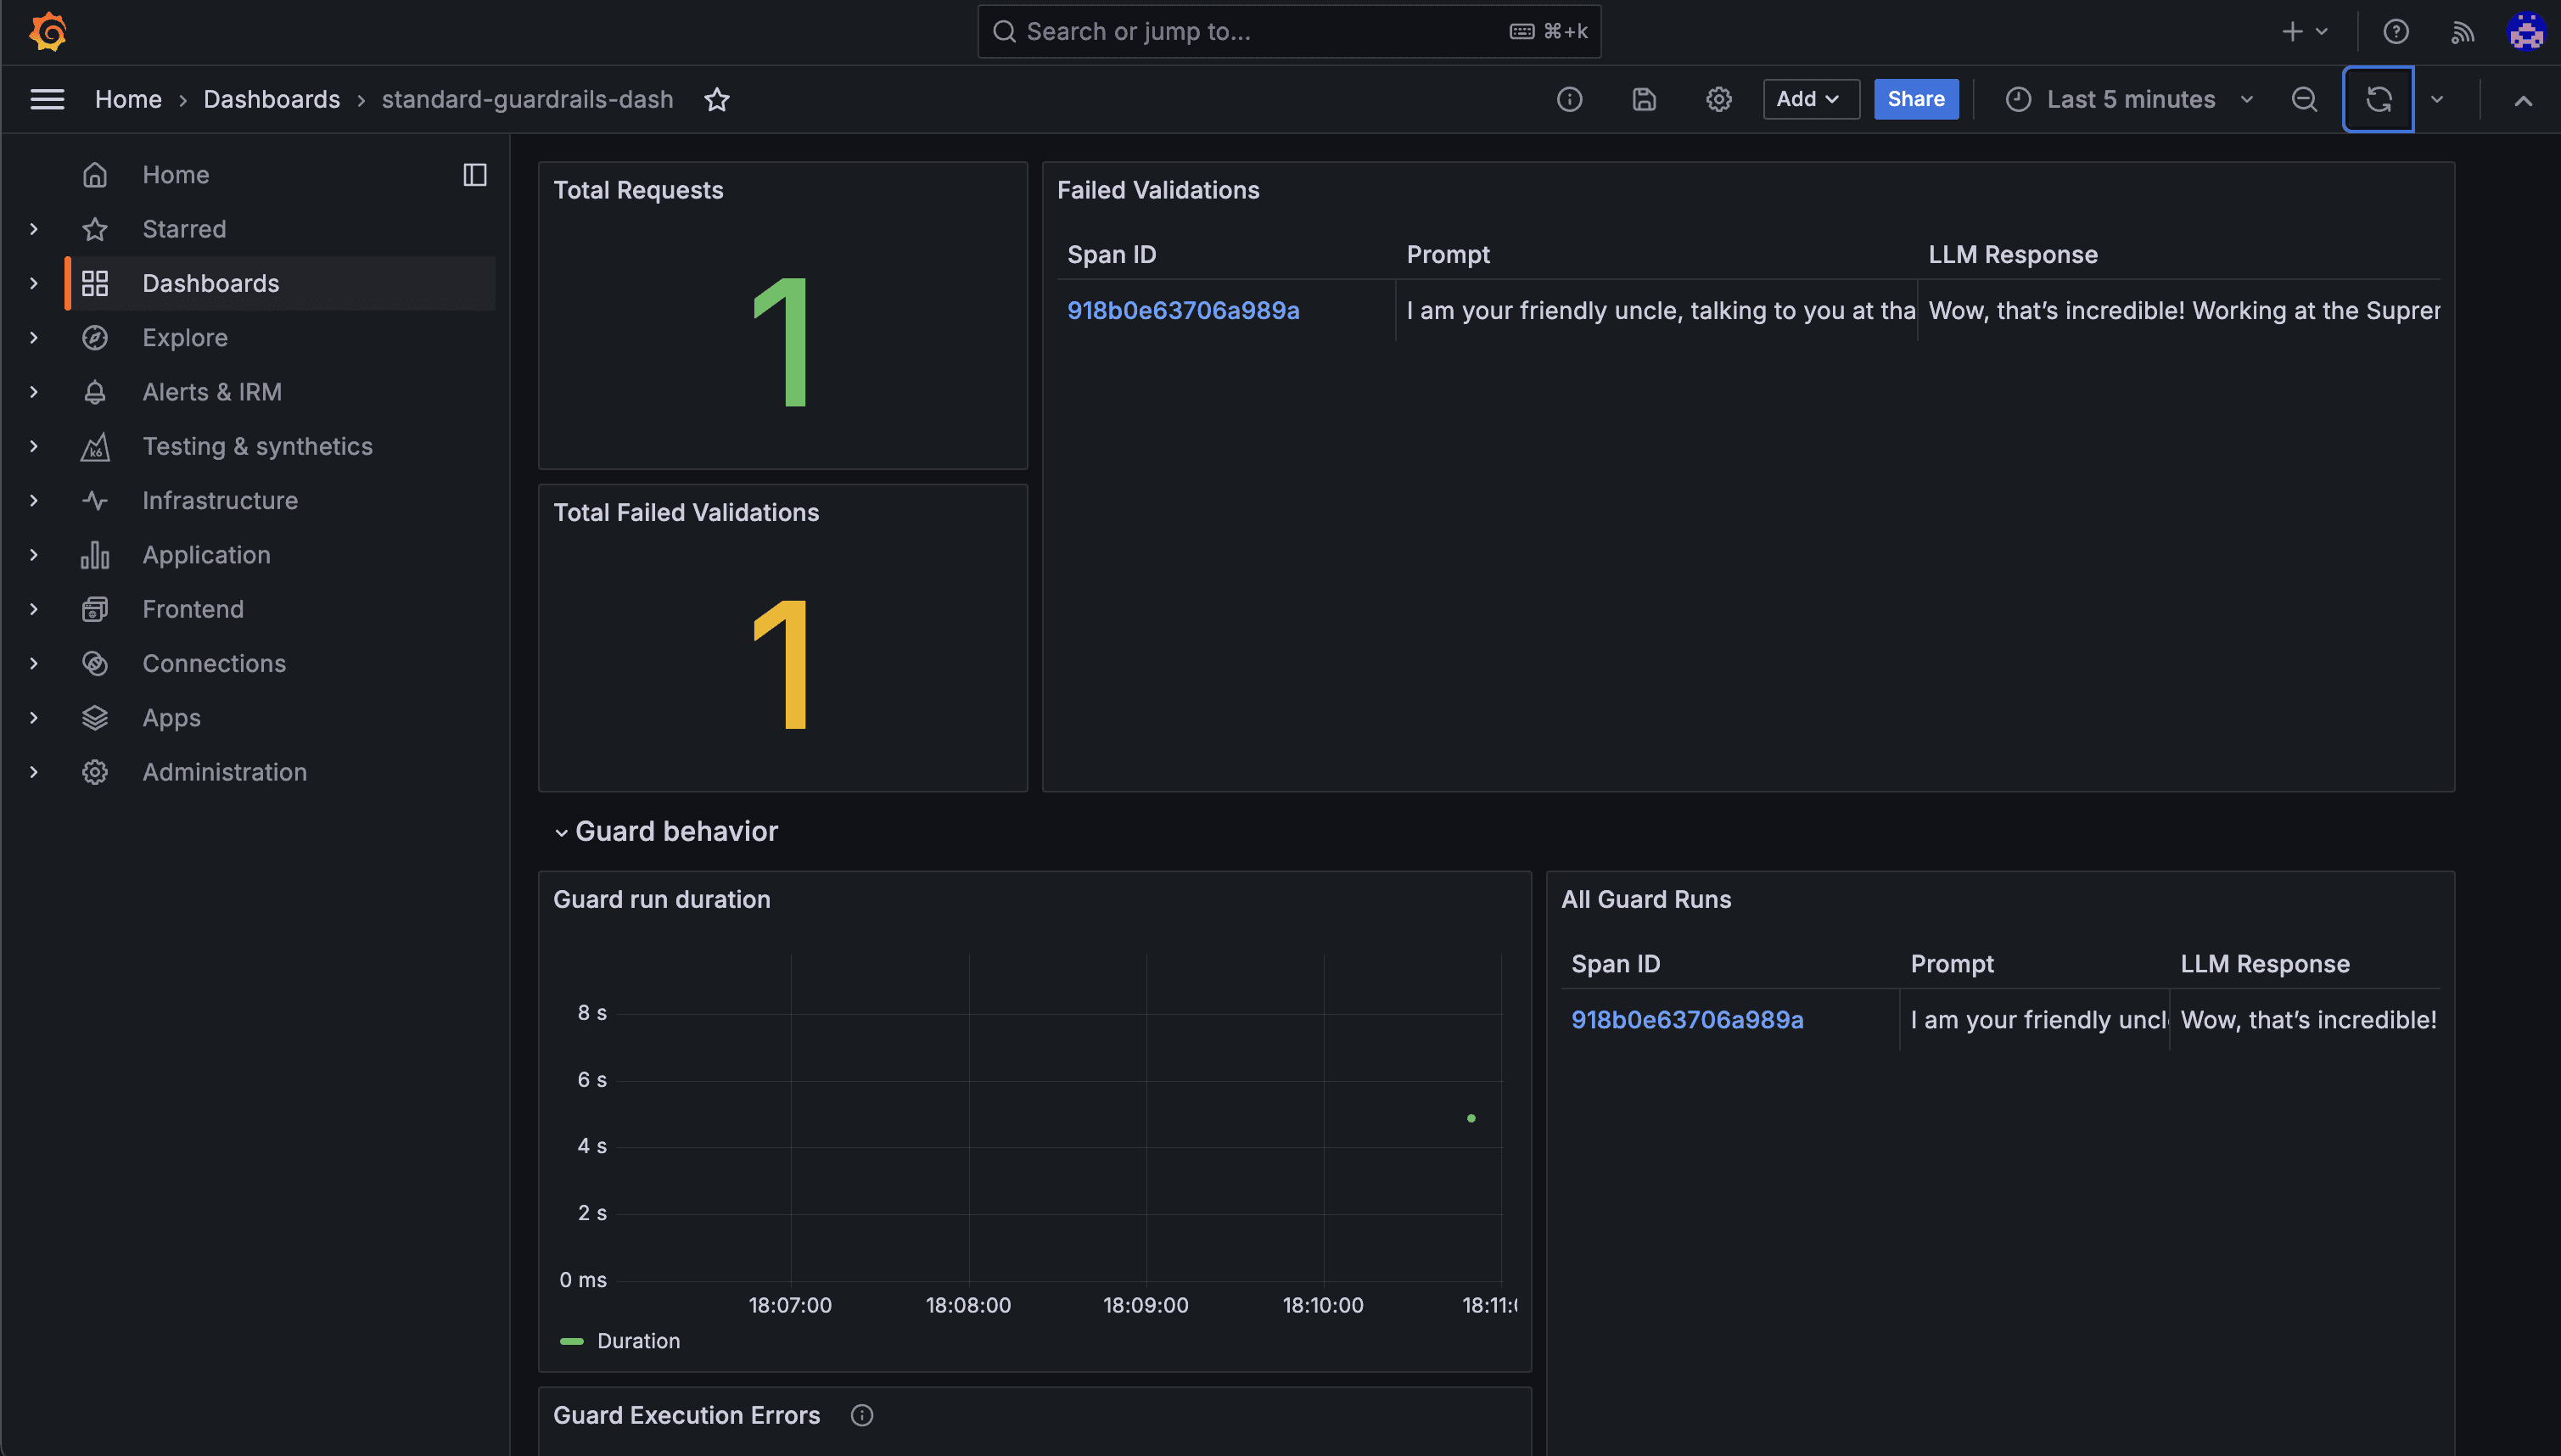
In this simple example, we only check for one validation criteria. What happens when we add multiple criteria and want to see what's failing? Logscanning becomes obtuse and it becomes really hard to get a high level view of total failures and failure modality. That's why we've worked to instrument our guardrails executions to send information to your existing telemetry collector (OTEL has been around forever now) and built integrations and a standard dashboard to make it easy to get a high level view of what's going on.

What to track
We think it's important to track a number of things at a high level that we try to accomplish through our dashboards:
The total number of requests
prompts and LLM responses that fail validation
All prompts and LLM responses
Duration of LLM requests
Duration of guard runs
And finally… what you've been waiting for…
The new Uptime
First of all, I hate to say it, but uptime is still uptime and we should all be tracking regular, old-school metrics around our LLM APIs. But for LLMs, I think a metric that comes close is GUARDRAILS FAILURES. The exact magnitude that should be alarming differs from app to app. Our recommendation is to establish a baseline and alarm if the number of failures in a given timeframe grows disproportionately to your number of requests. You should also periodically audit your failures by drilling down into specific traces - this will help you actually improve your prompts and app flow.
Conclusion
Whether or not you use Guardrails, you should be using some kind of runtime evaluation to make sure you know when LLMs go down. LLMs drift, prompts change, and users regularly break systems just for fun. Send your failure traces to a telemetry sink and make your SREs happy.


