Overview
In this document, we explain how to set up Guardrails with MLflow Tracing. With this functionality enabled, you can collect additional insights on how your Guard, LLM, and each validator are performing directly in your own Databricks workspace. In this notebook, we’ll be using a local MLflow Tracking Server, but you can just as easily switch over to a hosted Tracking Server. For additional background information on Mlflow Tracing, see the MLflow documentation.Installing Dependencies
Let’s start by installing the dependencies we’ll use in this exercise. First we’ll install Guardrails with thedatabricks extra. This will include the mlflow library and any other pip packages we’ll need.
Starting the MLflow Tracking Server
Our next step is to start the MLflow Tracking server. This stands up both the telemetry sink we will send traces to, as well as the web interface we can use to examine them. You’ll need to run this next step is a separate terminal since, otherwise, the server’s processes will block execution of the conesecutive cells in this notebook (which is normal).Creating and Instrumenting our Guard
Next up, we’ll instrument the Guardrails package to send traces to the MLflow Tracking Server as well as setup our LLM and Guard. As ofguardrails-ai version 0.5.8, we offer a builtin instrumentor for MLflow.
Testing and Tracking our Guard
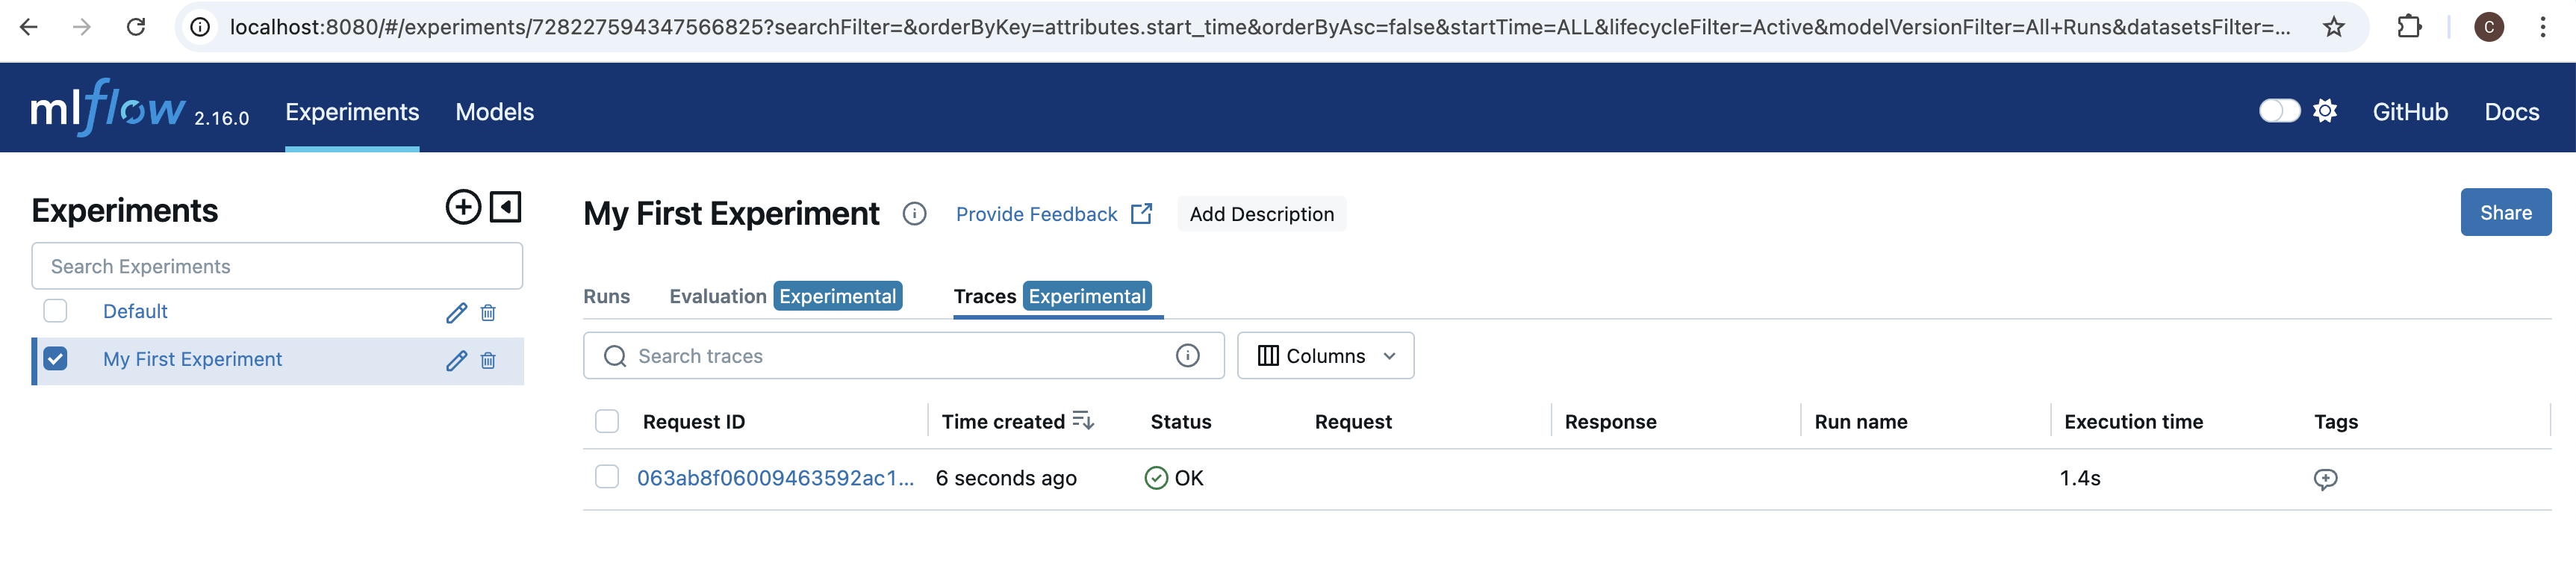
Next we’ll test our our Guard by calling an LLM and letting the Guard validate the output. After each execution, we’ll look at the trace data collected by MLflow Tracking Server.My First Experiment, in the list on the left hand side. If we select our experiment, and then select the Traces tab, we should see one trace from the cell we just ran.
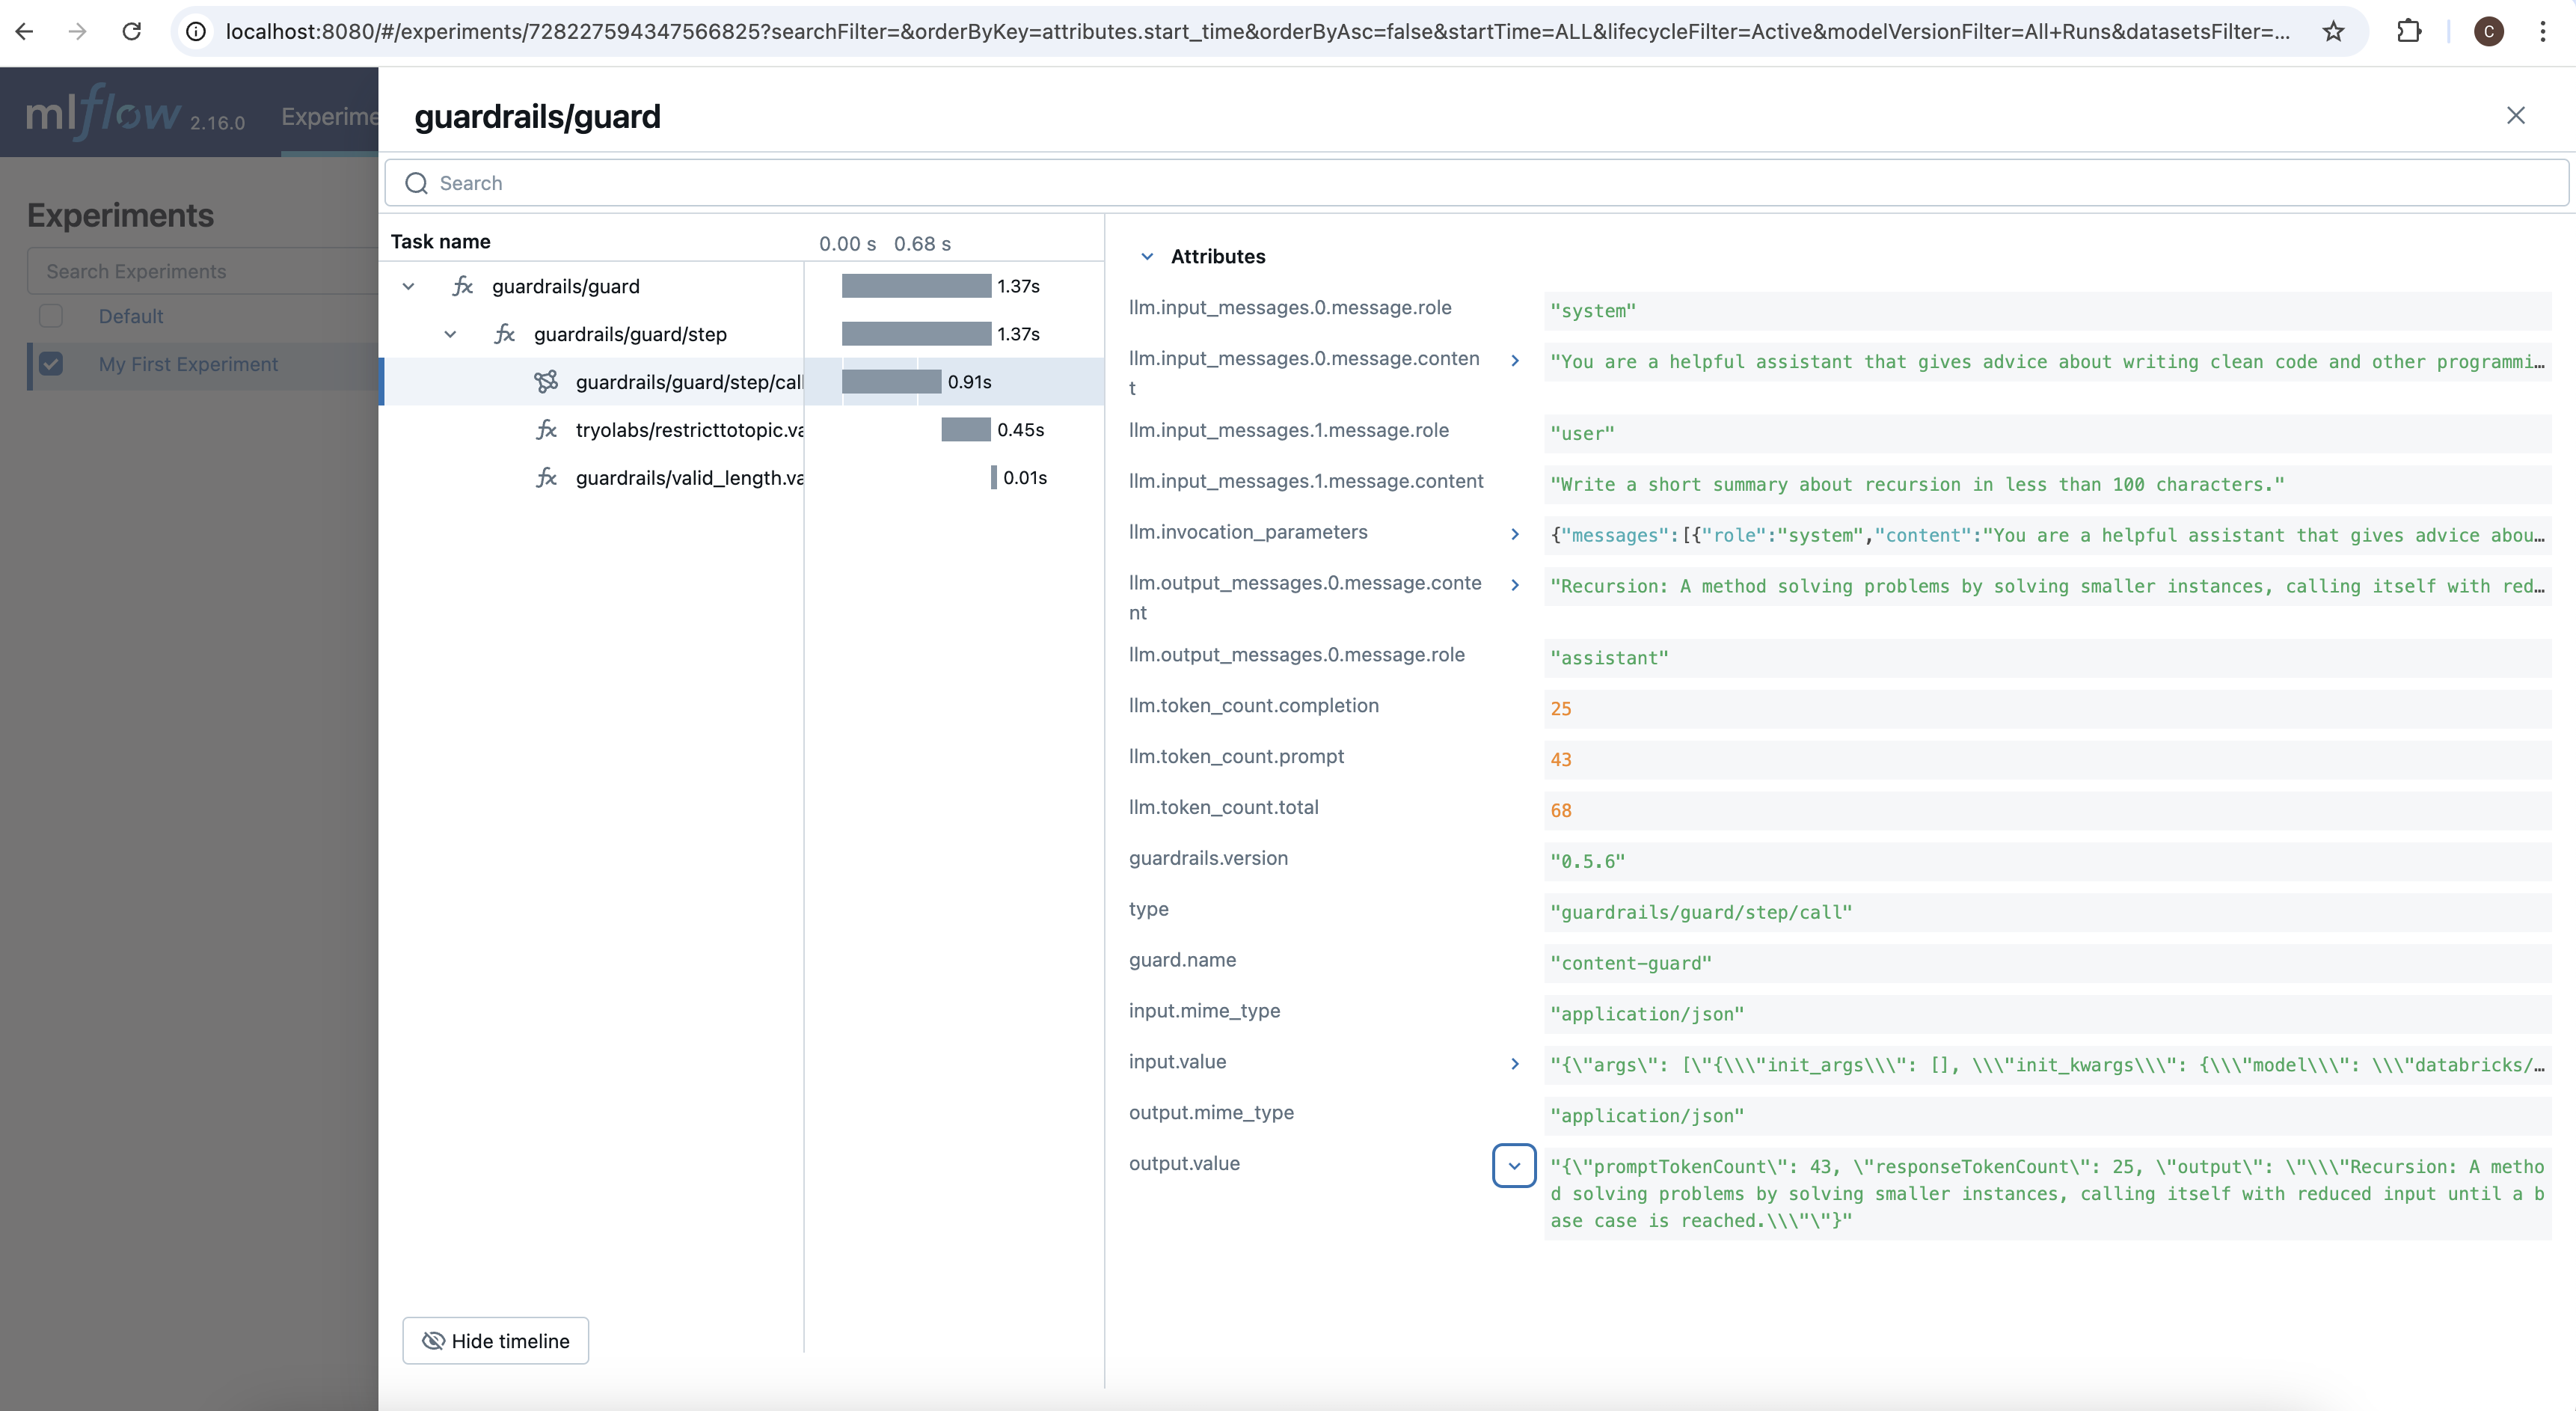
guardrails/guard/step/call, the span that tracked the call to the LLM, you can see all of the parameters that were used to call the LLM, as well as all of the outputs from the LLM including token counts.
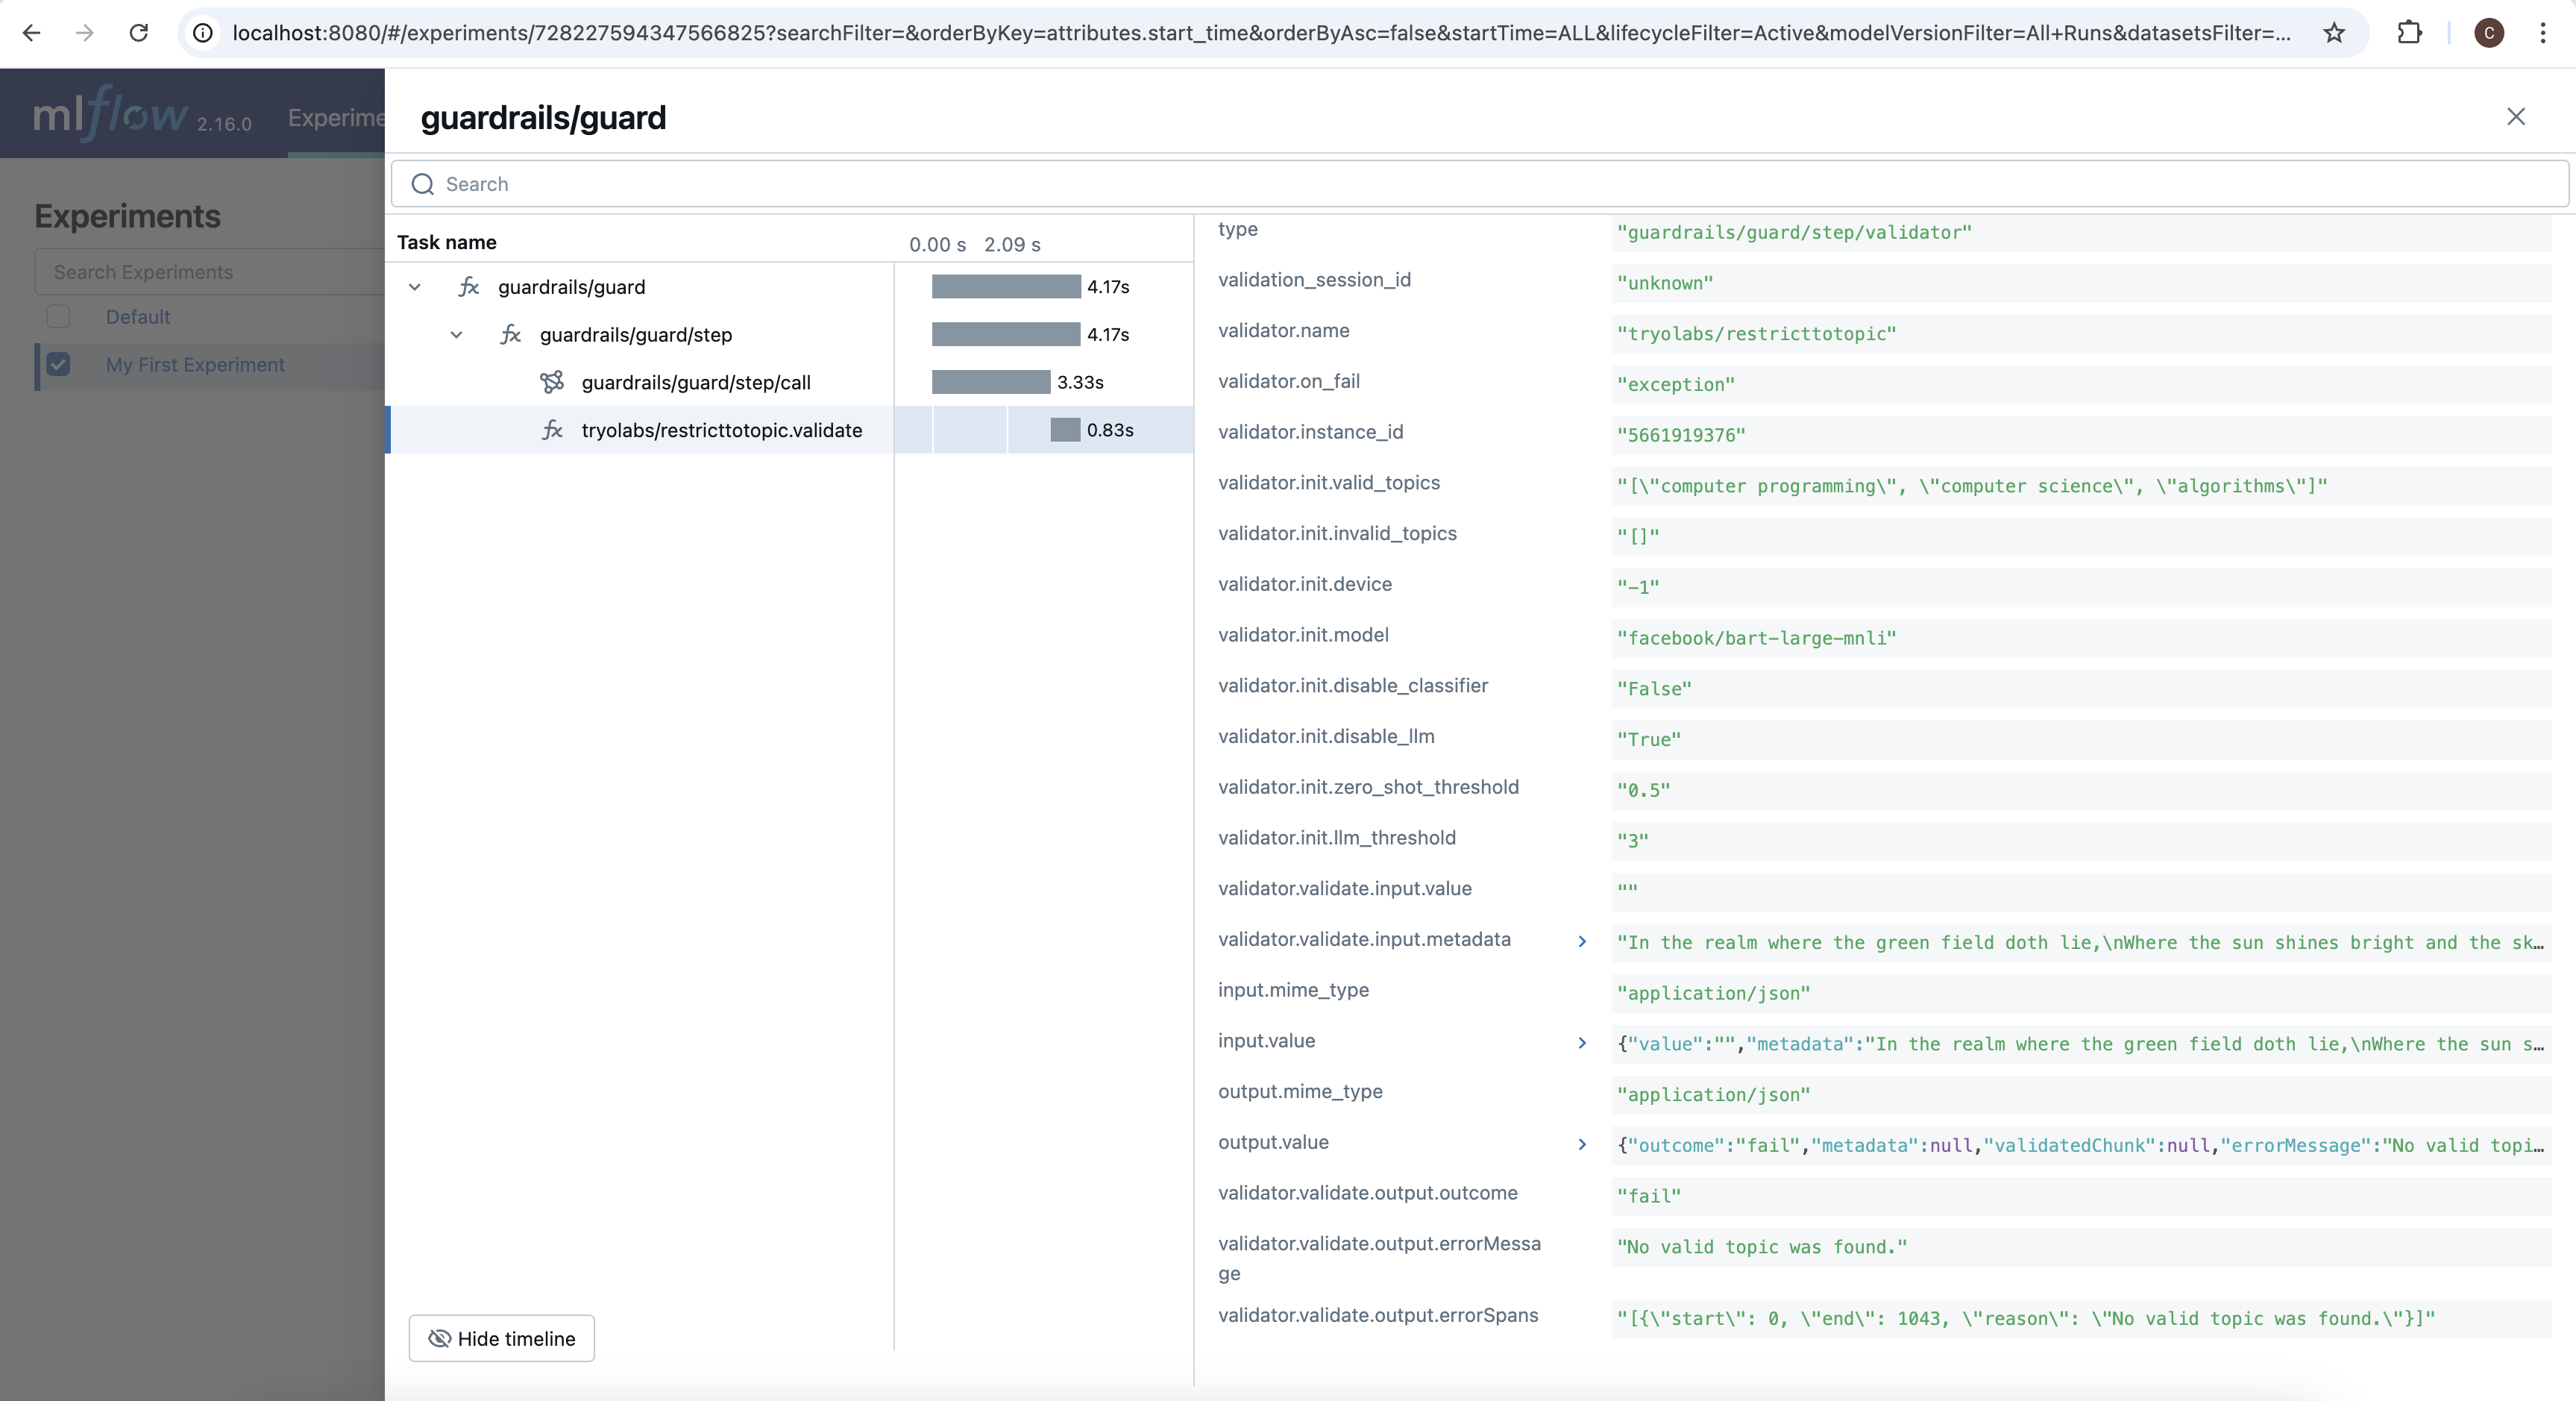
RestrictToTopic. This is because since we set on_fail="exception", the first failure to occur will raise an exception and interrupt the process. If we set our OnFail action to a different value, like noop, we would also see a log for ValidLength since the LLM’s output is clearly longer than the max length we specified.
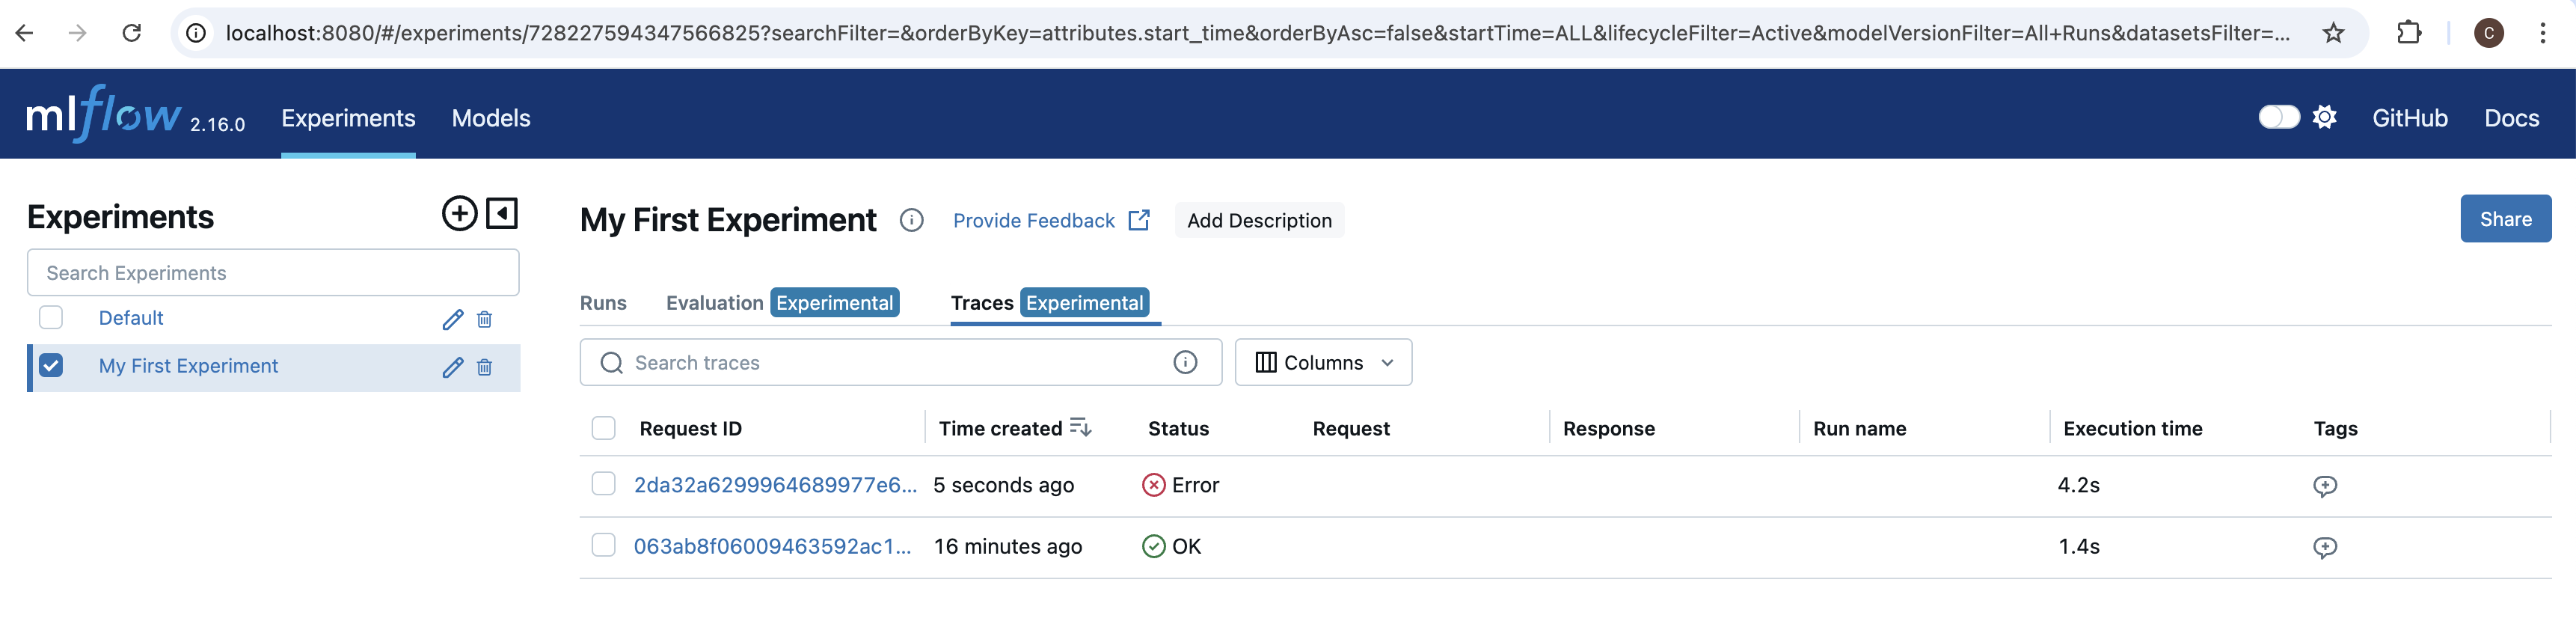
If navigate back to the MLflow UI in our browser, we see another trace. Since this last cell raised an exception, we see that the status is listed as Error.
RestrictToTopic has a recorded span. This is, again, because it raised an exception on failure exitting the validation loop early.
If we click on the validator’s span, and scroll down to the bottom of its details panel, we can see the reason why validation failed: "No valid topic was found."